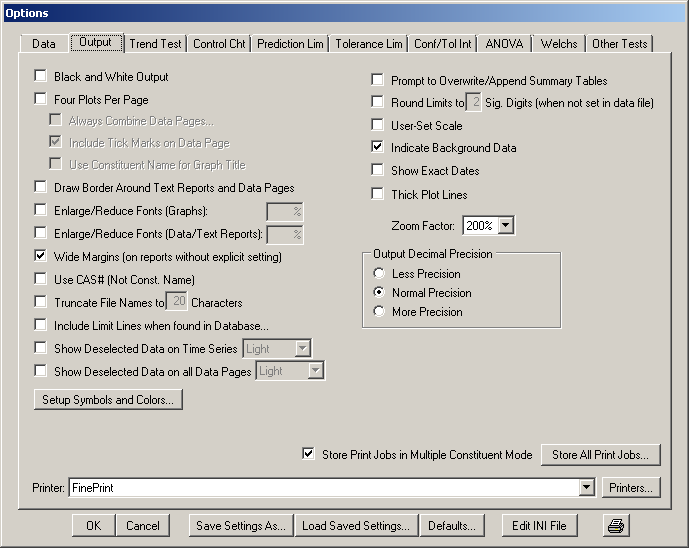
Figure 5.8: the Output tab of the Configure Sanitas window (Options/Configure Sanitas)
Black and White Output: Check this checkbox if you are printing to a black and white printer or other monochrome output device, and if the default colored graphs are not well represented when converted to black and white. This option causes all graph elements to be printed in black (except for comparison of multiple Power Curves, which is not implemented for black and white mode).
Four Plots per Page: This feature is designed to reduce the amount of paper required for printing analyses. When used in single-constituent mode, you can print the graphs at any time, and need not wait until four images have been stored. After four images have been stored, however, printing is recommended, as these images will not be saved in Sanitas. If you do not have the “Always Combine Data Pages” option (see below) selected, and you wish to print the data pages, you will need to select “Print Data” after generating individual graphs. When the “Four Plots per Page” option is selected, it may be desirable to increase the font size (also under the Output tab in the Configure Sanitas window). Note: in interactive mode, if the most recent quadrant is determined to be unwanted, it can be removed. To do so, click the Exit button (prior to printing the graph or data page). You will then be given options as shown in the following screen shot.
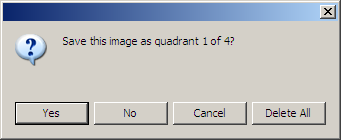
Figure 5.9: Options for handling the Most Recent Quadrant
Always Combine Data Pages: Data pages are automatically combined, four per page, for intrawell and similar tests when Four Plots Per Page is selected. For interwell and similar tests, however, the data for each report will occupy a separate page, unless Always Combine Data Pages is selected. This feature is not recommended for Box & Whisker Plots and Compliance Limits tests, because the data pages for these reports contain summary rows, which are discarded when combining data pages. In addition, combined data pages are not available for Power Curves or Composite tests, and for distributional graphs in which the wells are divided by Sanitas for purposes of plotting.
Include Tick Marks on Data Page: Particularly when Always Combine Data Pages is checked, it can sometimes be difficult to distinguish the data columns corresponding to the individual reports. Check this option to add a small “tick mark” or “hash mark” as a separator before the first well of each report’s data.
Use Constituent Name for Graph Title: By default, the graph title is the type of report or test run, and the constituent tested is listed below the graph in a smaller font. Checking this option switches the content of these two fields, so the graph title becomes the constituent name and the report type is printed below the graph.
Draw Border Around Text Reports and Data Pages: When selected, textual report pages are printed with a solid box surrounding the entire print area.
Enlarge/Reduce Fonts (Graphs): When selected, the accompanying numeric field is enabled, allowing a user-entered percentage to adjust fonts on printed reports (data pages are unaffected). This option is included because Windows™ automatically substitutes fonts when the default fonts called for by Sanitas are not available, and this may cause the text to either run together or extend off the page if the substituted font size is not adjusted. Most Sanitas reports use regular, bold, and italic styles of Arial, Roman, and Modern.
Enlarge/Reduce Fonts (Data/Text Reports): Same as Enlarge/Reduce Fonts (Graphs), but applies to data pages and textual reports.
Wide Margins (on reports without explicit setting): When selected, the non-printing margin area around the outside of printed report pages is increased. This is useful when reports will be bound. The width of Wide Margins is user adjustable as MARGIN_WIDTH_PERCENTAGE in the relevant sections of the Sanitas9.ini file (see the section on editing the Sanitas9.ini file). This option does not affect the margins on reports such as Summary Tables that have their own print setup page containing an option for margin width.
Use CAS# (Not Const. Name): When selected, the constituent name is replaced with the CAS number on printed reports. In order for the CAS# to be used, it must be present in the data file. See the data file structure section for more information.
Truncate File Names to ___ Characters: When selected, the accompanying numeric field is enabled, allowing a user-entered maximum file name length (8…999) for use with long file names on printed reports.
Include Limit Lines when found in Database: When checked, Sanitas will add limit lines where values exist in the "Additional Limit" field of the constituent table of the database file. See the section on editing the database for information on viewing and editing the database file. This is only implemented for Time Series and Prediction Limit reports in this version.
Show Deselected Data on Time Series: When checked, Sanitas will add points on the Time Series report to indicate values that are present but “deselected”. This can include points that are manually unchecked in the current View, and also values that are deselected by flag (see option on the Data tab). When this option is checked, the accompanying drop down list is enabled, containing a choice of visibility options for these points.
Show Deselected Data on all Data Pages: When checked, Sanitas will add points on the Data Page for all reports (including but not limited to Time Series) to indicate values that are present but deselected. When this option is checked, the accompanying drop down list is enabled, containing a choice of visibility options for these points.
Setup Symbols and Colors… : Opens the Select Colors and Symbols window, in which data file specific settings may be defined.
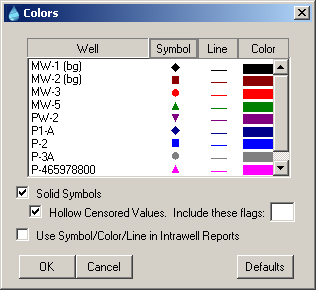
Figure 5.10: Select Colors and Symbols Window
Click a symbol, line or color for a well to toggle among the available choices. Or click the column header to set the entire column to a single value and toggle all wells at once.
Options:
Solid Symbols: Restricts the Symbol set to only those with a solid fill. When this option is checked, a sub-option becomes enabled:
Hollow Censored Values : Used in conjunction with Solid Symbols above, this option will cause Sanitas to display a hollow symbol to indicate non-detect and/or trace values. The Include these flags field allows the user to enter a flag such as “j” or “tr” (the latter of which is actually two flags to be clear, so while it would achieve the desired effect, entering “t” or “r” would also be sufficient to include values flagged with “tr”). Values having flag characters found in this field will be plotted hollow in addition to the default of values beginning with the character “<”.
Use Symbol/Color/Line in Intrawell Reports: By default, the settings in this window only apply to multiple-well graphs such as Time Series, as opposed to single-well-only reports. Checking this box will extend the behavior to intrawell graphs.
Prompt to Overwrite/Append Summary Tables: By default, Sanitas v.9 creates a new Summary Table each time a Multiple-Constituent job is started. Otherwise (when individual constituent reports are run) it appends if the summary table already exists, and creates a new summary table otherwise. When adding records, if a record already exists for the same well and constituent it is overwritten. Version 8.7 prompted the user each time a test was selected as to whether an existing summary table should be overwritten or appended to, and whether duplicate records (i.e. two records for the same well and constituent) in the summary table should be allowed. Check this checkbox to have the same behavior as 8.7 regarding the creation of Summary Tables.
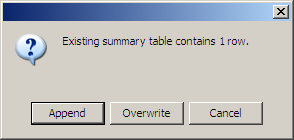
Figure 5.11: Prompt to Overwrite/Append Summary Tables
Round Limits to __ Significant Digits (when not set in data file): When selected, a number (1-9) may be entered to customize the number of significant digits that limits are rounded to in the display of analysis results. This option currently applies only to limit values in (parametric and nonparametric) Prediction Limit and Tolerance Limit reports.
This option applies to all constituents, but there is also a constituent-specific means of defining the number of significant digits. This is assigning a number to the Sig. Digits field in the Constituent table in the database. See the section on editingthe database for information on viewing and editing the database file.
User-Set Scale: When selected, the axes (which are otherwise automatically computed to best fit the data) become manually adjustable. You will be presented with proposed minimum and maximum values, which may be edited. For example, a Time Series can be scaled to match a plot previously printed.
If you intend to use the default scaling, the data in the overall View determine the scaling. For instance, even if a well is deselected in the Observations Panel, those deselected observations will continue to affect the scaling. In this way, multiple time series graphs may be created for a single view, using a consistent scale.
Indicate Background Data: When selected, background well (or monitoring point) names will be followed by the characters assigned to BACKGROUND_DATA_INDICATOR in the Sanitas9.ini file, which by default is set to “ (bg)”. See the section on editing the Sanitas9.ini file if you want to change the default.
Show Exact Dates: When selected, exact sampling dates will be used on all time series plots, tolerance limits and prediction limits.
When Show Exact Dates is turned off (the default mode), Sanitas will use the first and last sampling dates, as well as regular intervals between the two, as the X-axis labels.
Thick Plot Lines: When selected, in single-well line graphs, the lines connecting data points are plotted thicker. Examples of single-well line graphs are Intrawell Limits. In the case of multiple-well graphs, the line thickness is defined on a well-by-well basis in the Setup Symbols and Colors window described above.
Zoom Factor: The Zoom Factor allows you to adjust the magnification when the “zoom” functionality is used to view plots and data on the computer screen. This value can also be adjusted by right-clicking when in the zoom window and selecting from the context menu.
Output Decimal Precision: More Precision or Less Precision may optionally be selected. This option varies the relative number of decimal places reported in most reports and screen output throughout the program. The actual decimal places reported depends on the magnitude of the number. Calculations are unaffected.
Store Print Jobs in Multiple Constituent Mode: When this option is checked, launching a Multiple Constituent run (that is, selecting an item from the Analysis menu when the selected Constituent is “MULTIPLE CONSTITUENTS>>>”) will open a new window entitled Stored Print Jobs. When this window is open, printing will be deferred, and a preview will be created instead. When the Multiple Constituent run is finished, the window will remain, allowing for viewing of the reports before printing. Until this window is closed by the user, any printing will be added to the preview, so interactive reports can be added. Finally, a right-click menu allows for reordering and deletion of pages. Then the entire set of reports can be printed as a single print job.
Store All Print Jobs: Opens the Stored Print Jobs window, described above, for use with interactive (as well as Multiple Constituent) reports.
Printer:This drop down list can be used to change the “current” printer, which is the printer that all Sanitas reports will be sent to unless otherwise specified.
Printers…Opens the Printers dialog, also available through the Windows Control Panel. Configuring printers and changing and/or configuring the default printer is done through this interface, which is a part of Windows and may vary by Windows version.